


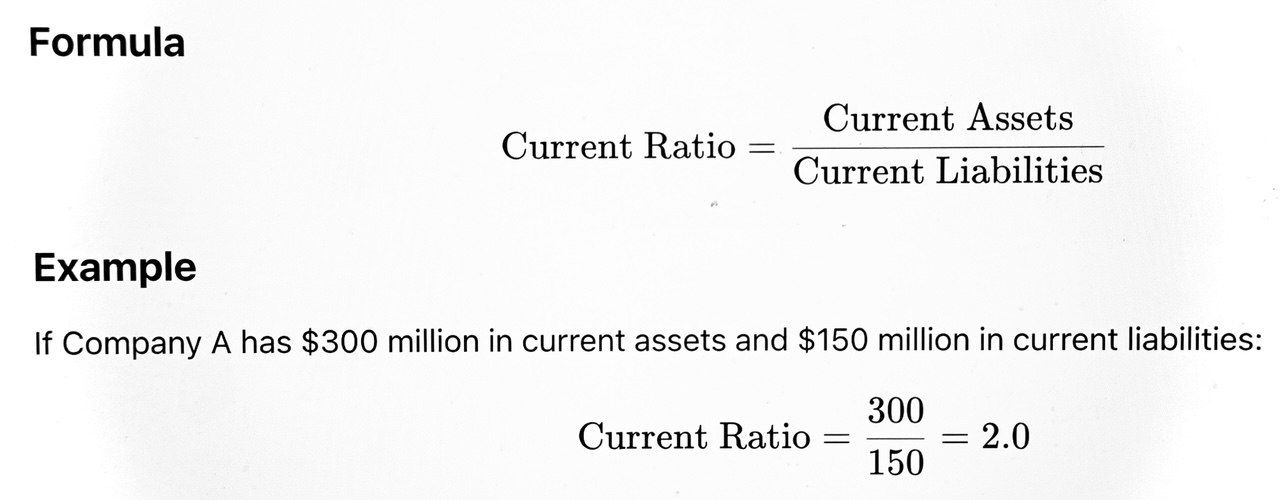
Current Ratio
Definition
The current ratio measures a company’s ability to pay its short-term liabilities with its short-term assets.
Interpretation & Usage
A ratio above 1.0 means the company can cover its short-term debts; higher is generally better, but an extremely high current ratio may indicate inefficient use of assets. Some industries operate comfortably with lower ratios due to fast inventory turnover or predictable cash flows.
Buy/Sell Strategy
Buy: Companies with a solid current ratio (typically >1.5), especially if improving, can weather economic downturns and unexpected expenses.
Sell: A declining or low current ratio (<1) signals possible liquidity trouble and risk of default, which can precede stock price declines.
Practical Example:
During the COVID-19 pandemic, investors favored retailers and manufacturers with strong current ratios, anticipating those with weak liquidity could struggle or go bankrupt.
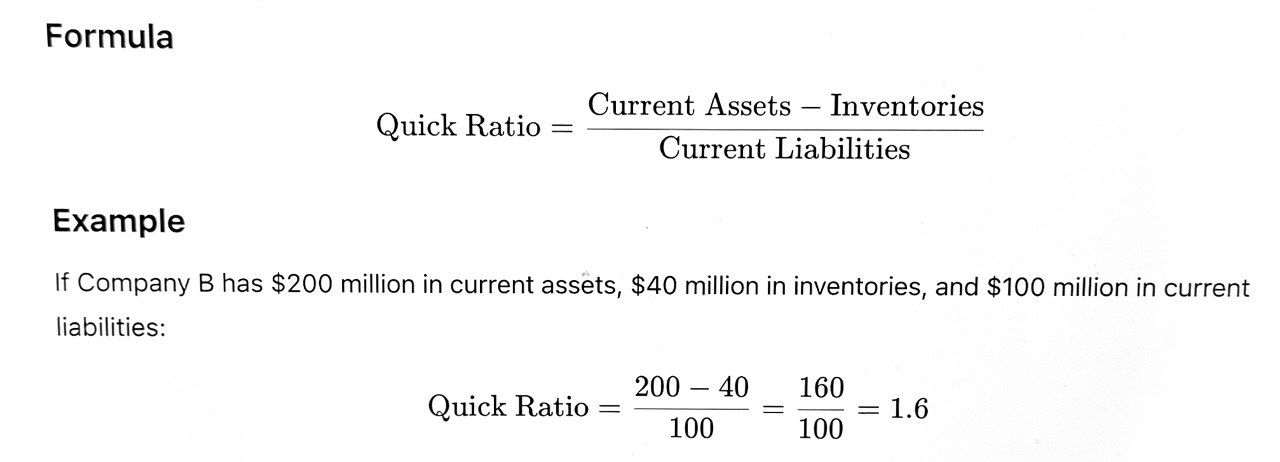
Quick Ratio (Acid-Test Ratio)
Definition
The quick ratio refines the current ratio by excluding inventory (the least liquid current asset), providing a stricter test of short-term solvency.
Interpretation & Usage
A ratio of at least 1.0 is considered safe for most industries. It’s particularly important for businesses with slow-moving or hard-to-sell inventory (e.g., heavy machinery, specialty goods).
Buy/Sell Strategy
Buy: Companies with a quick ratio >1 and stable or improving.
Sell: Quick ratio <1, especially if it’s falling or inventories are ballooning, may indicate cash-flow crunch.
Practical Example:
Tech companies, which typically have minimal inventories, often boast very high quick ratios, reassuring investors of their liquidity.
Cash Ratio
Definition
The cash ratio is the most conservative liquidity measure, assessing the company’s ability to pay off current liabilities with cash and cash equivalents alone.

Interpretation & Usage
A cash ratio >1 is rare and indicates very conservative management. For most industries, a ratio of 0.2–0.5 is common. Too high may suggest idle resources; too low may signal risk during sudden downturns.
Buy/Sell Strategy
Buy: Strong, stable cash ratio, especially in cyclical or crisis-prone sectors.
Sell: Deteriorating cash ratios, particularly if paired with negative cash flow, signal risk.
Practical Example:
Investors looked favorably on companies like Apple and Google (Alphabet) with large cash cushions during the 2008–2009 crisis, as these firms could invest, buy distressed rivals, or support dividends.
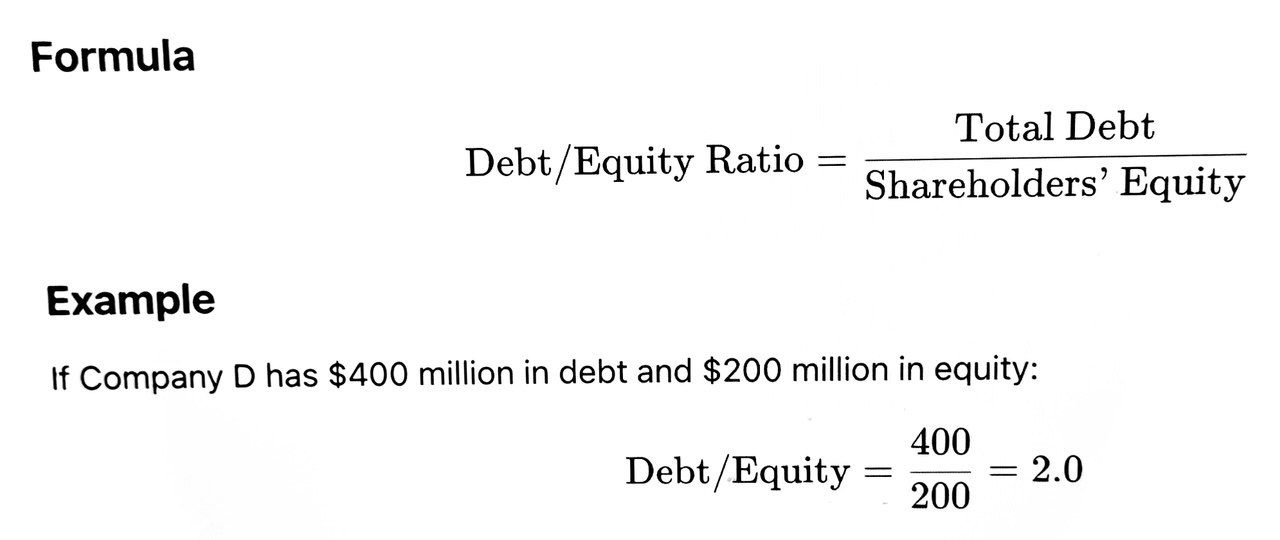
Debt/Equity Ratio
Definition
The debt/equity (D/E) ratio compares total liabilities to shareholder equity, reflecting the degree of financial leverage used.
Interpretation & Usage
A ratio >1 means the company is more financed by debt than equity. Acceptable levels vary by industry: utilities and banks may have high D/E, while tech firms prefer low leverage.
Buy/Sell Strategy
Buy: Low or declining D/E ratios, or stable ratios in sectors where debt is normal.
Sell: Rising D/E, especially when accompanied by falling profits or rising interest rates, can foreshadow financial distress.
Practical Example:
In rising interest rate environments, investors favor companies with low D/E, as higher rates increase the cost of debt and risk of default.
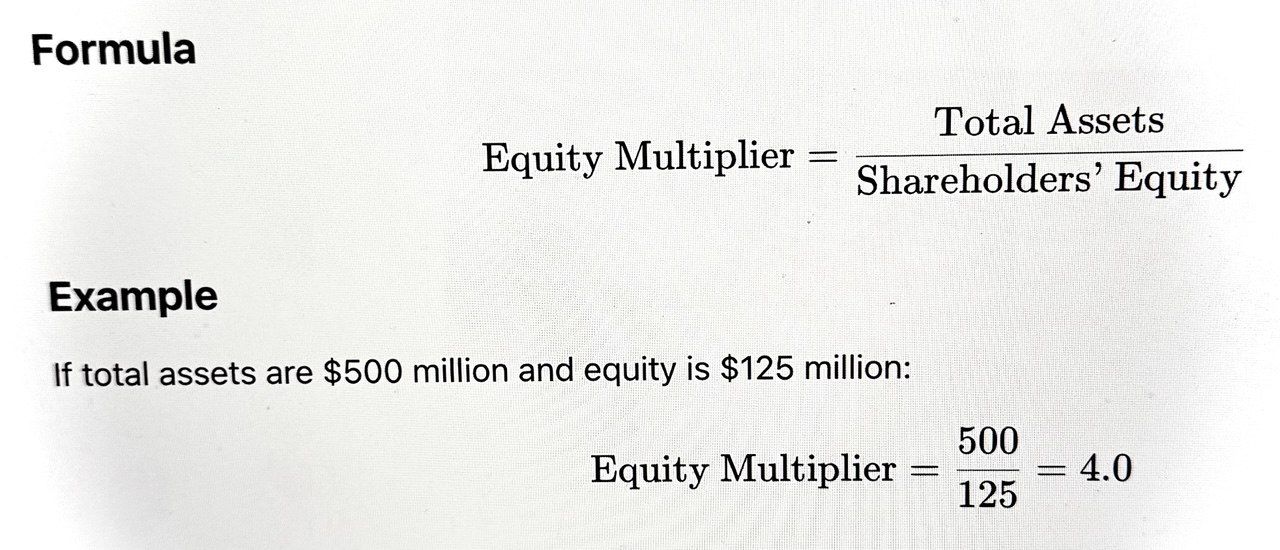
Equity Multiplier
Definition
The equity multiplier shows how much of a company’s assets are financed by shareholders' equity versus debt.
Interpretation & Usage
A high multiplier indicates greater financial leverage. Used in DuPont analysis to decompose return on equity.
Buy/Sell Strategy
Buy: Companies with appropriate leverage for their industry.
Sell: Excessive multipliers, especially if accompanied by volatile earnings.
Interest Coverage Ratio
Definition
The interest coverage ratio measures how easily a company can pay interest on outstanding debt from operating earnings.
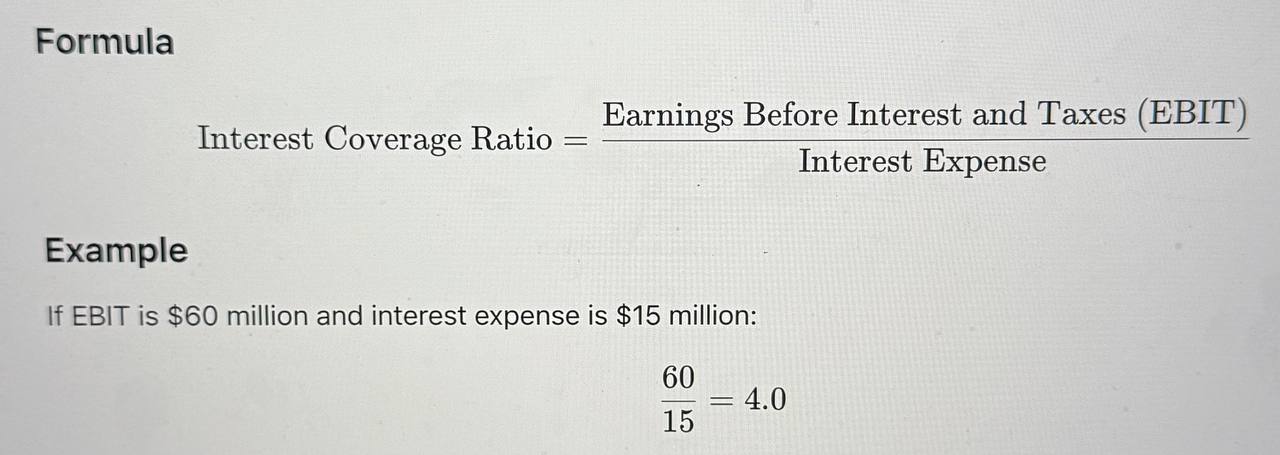
Interpretation & Usage
A ratio below 2.0 is concerning. The higher, the safer. Used by creditors to assess loan risk.
Buy/Sell Strategy
Buy: Ratios comfortably above 2–3, especially if improving.
Sell: Ratios below 2 or trending downward, especially if cash flow is weak.
Practical Example:
After oil prices crashed in 2015, oil producers with low interest coverage were among the first to default and saw their stocks plummet.
Operating Cash Flow Ratio
Definition
This ratio compares operating cash flow (OCF) to current liabilities, showing the company’s ability to cover short-term debts with cash generated from core business.
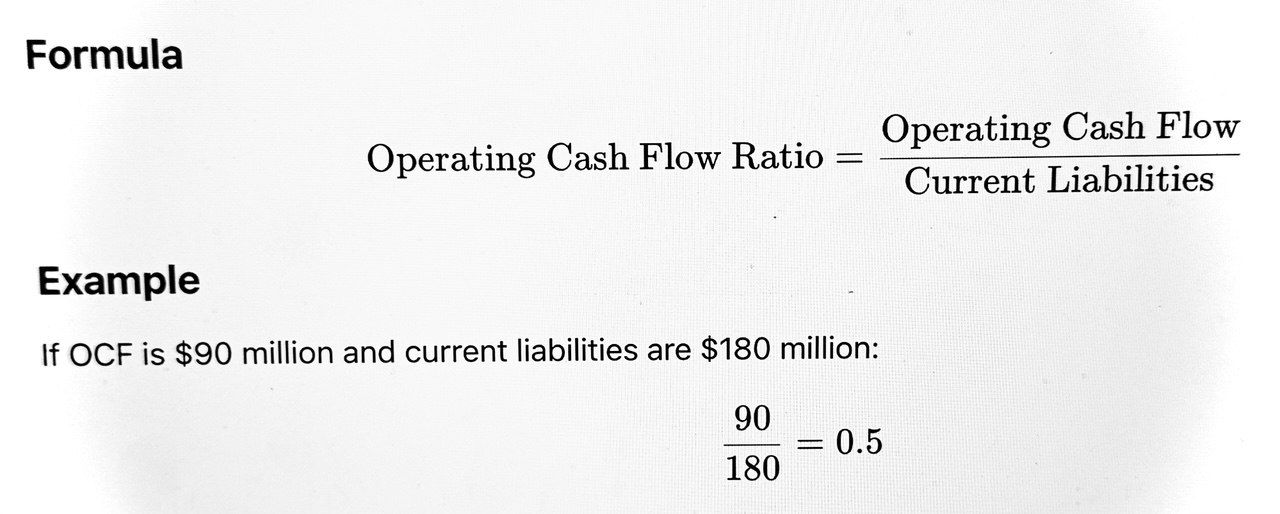
Interpretation & Usage
A higher ratio (>1) means the business generates enough cash to cover its short-term debts.
Buy/Sell Strategy
Buy: Ratios at or above 1, especially with stable or growing cash flow.
Sell: Persistent ratios below 1 warn of cash-flow risks.
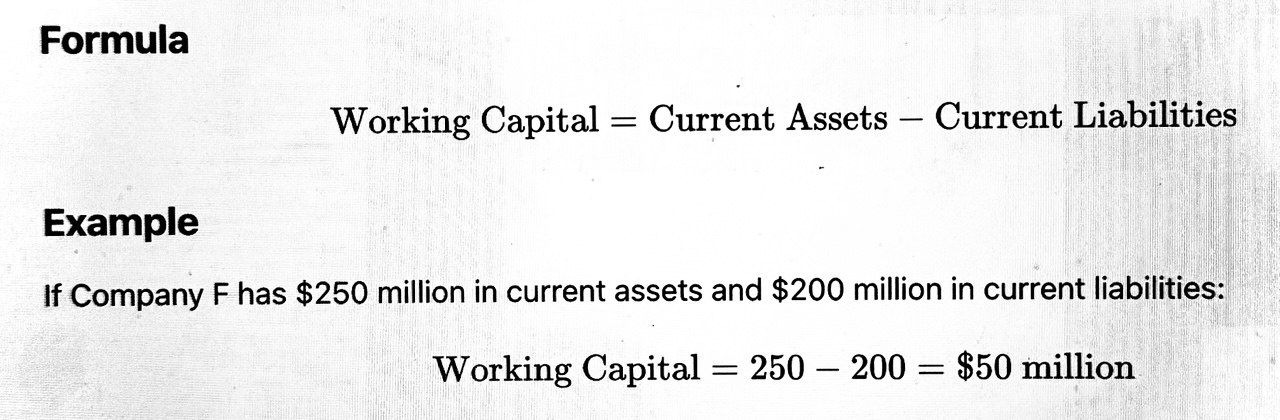
Working Capital Strategies
Definition
Working capital is the difference between current assets and current liabilities; it is not a ratio but a key indicator of short-term financial health.
Interpretation & Usage
Positive working capital enables companies to pay bills, invest in growth, and handle emergencies. Negative working capital can be a sign of trouble.
Buy/Sell Strategy
Buy: Positive and increasing working capital, especially in industries with seasonal swings.
Sell: Persistent negative working capital or unexplained declines.
Times Interest Earned (TIE)
Definition
Another name for the interest coverage ratio, TIE highlights a company’s ability to meet interest payments from earnings.
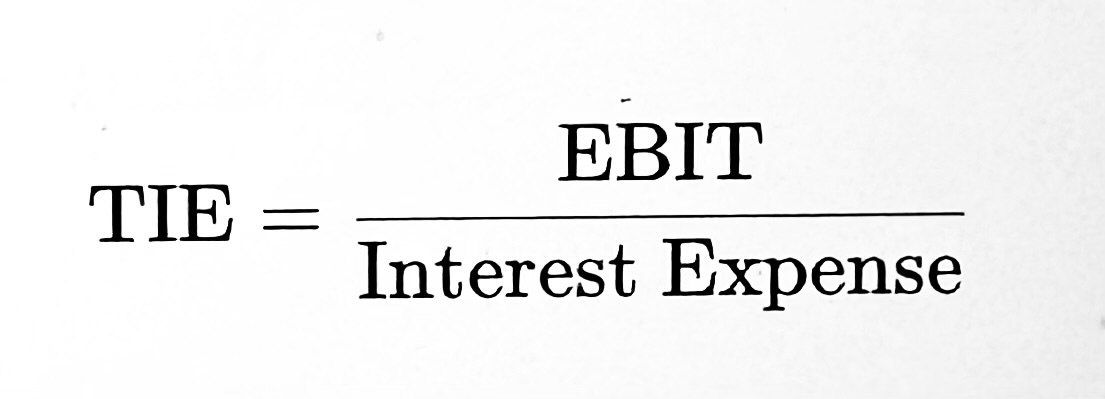
(This is the same as the Interest Coverage Ratio above.)
How Investors Use Liquidity and Leverage in Stock Decisions
- Risk-Averse Investors: Buy companies with high liquidity and manageable debt, especially in volatile markets or recessionary periods.
- Growth/Turnaround Investors: May buy companies with improving liquidity/leverage if paired with a credible recovery story.
- Income Investors: Favor strong liquidity to ensure dividends can be paid consistently.
- Short Sellers/Traders: Target firms with poor liquidity and high leverage as bankruptcy or distress candidates.
- Sector-Specific Investors: Adjust expectations—utilities and banks can safely run higher leverage, while tech startups should maintain robust liquidity.
Example in Practice:
During a credit crunch, stocks of companies with low current and quick ratios, high debt, and falling interest coverage often underperform or collapse, while those with healthy liquidity and modest leverage are viewed as safe havens.
References
White, G. I., Sondhi, A. C., & Fried, D. (2003). The Analysis and Use of Financial Statements. Wiley.
Damodaran, A. (2012). Investment Valuation: Tools and Techniques for Determining the Value of Any Asset. Wiley.
Graham, B., & Dodd, D. L. (2009). Security Analysis: Sixth Edition. McGraw-Hill.
CFA Institute. (2023). CFA Level 1 Curriculum – Financial Reporting and Analysis.
Investopedia. (2024). "Liquidity Ratios" and "Leverage Ratios".
Yahoo Finance, Company Filings and Ratios.