


Operating Cash Flow (OCF)
Definition
Operating Cash Flow is the cash generated by a company’s core business operations, excluding cash from investing or financing activities. It reflects how much cash is produced by day-to-day activities like sales, minus cash expenses.
Formula:
Operating Cash Flow= Net Income+Non-Cash Expenses+Changes in Working Capital
Most companies report OCF directly on the statement of cash flows.
Example
If Company A reports net income of $100 million, adds back $20 million in depreciation (a non-cash expense), and working capital changes increase cash by $10 million:
OCF=$100m+$20m+$10m=$130m
Interpretation & Usage
- High or rising OCF signals strong core operations and cash-generating ability.
- OCF can be much higher or lower than net income due to differences in accruals and real cash movement.
Buy/Sell Strategy:
- Buy: Companies with consistently strong and growing OCF, especially if OCF exceeds net income (conservative accounting).
- Sell: Companies with weak or declining OCF, especially if they report “paper profits” but fail to collect cash.
Real-World Example:
Amazon (AMZN) often reported low net profits but strong OCF during its growth years, reassuring investors that cash was still coming in.
Free Cash Flow (FCF)
Definition
Free Cash Flow is the cash a company generates after accounting for capital expenditures (CapEx)—money spent on maintaining or expanding assets like property, equipment, and technology. FCF shows what’s available for dividends, buybacks, paying down debt, or acquisitions.
FCF = Operating Cash Flow − Capital Expenditures (CapEx)
Example
If Company B has OCF of $200 million and CapEx of $70 million:
FCF=$200m−$70m=$130m
Interpretation & Usage
- Positive and growing FCF is a sign of financial strength and flexibility.
- Negative FCF isn’t always bad—rapidly growing companies may intentionally spend more than they generate in the short term.
Buy/Sell Strategy:
- Buy: Mature companies with strong, consistent, and growing FCF.
- Sell: Firms with persistent negative FCF not explained by profitable long-term investments.
Real-World Example:
Microsoft (MSFT) is prized for its steady and growing FCF, supporting its large dividends and buyback programs.
Price to Free Cash Flow (P/FCF)
Definition
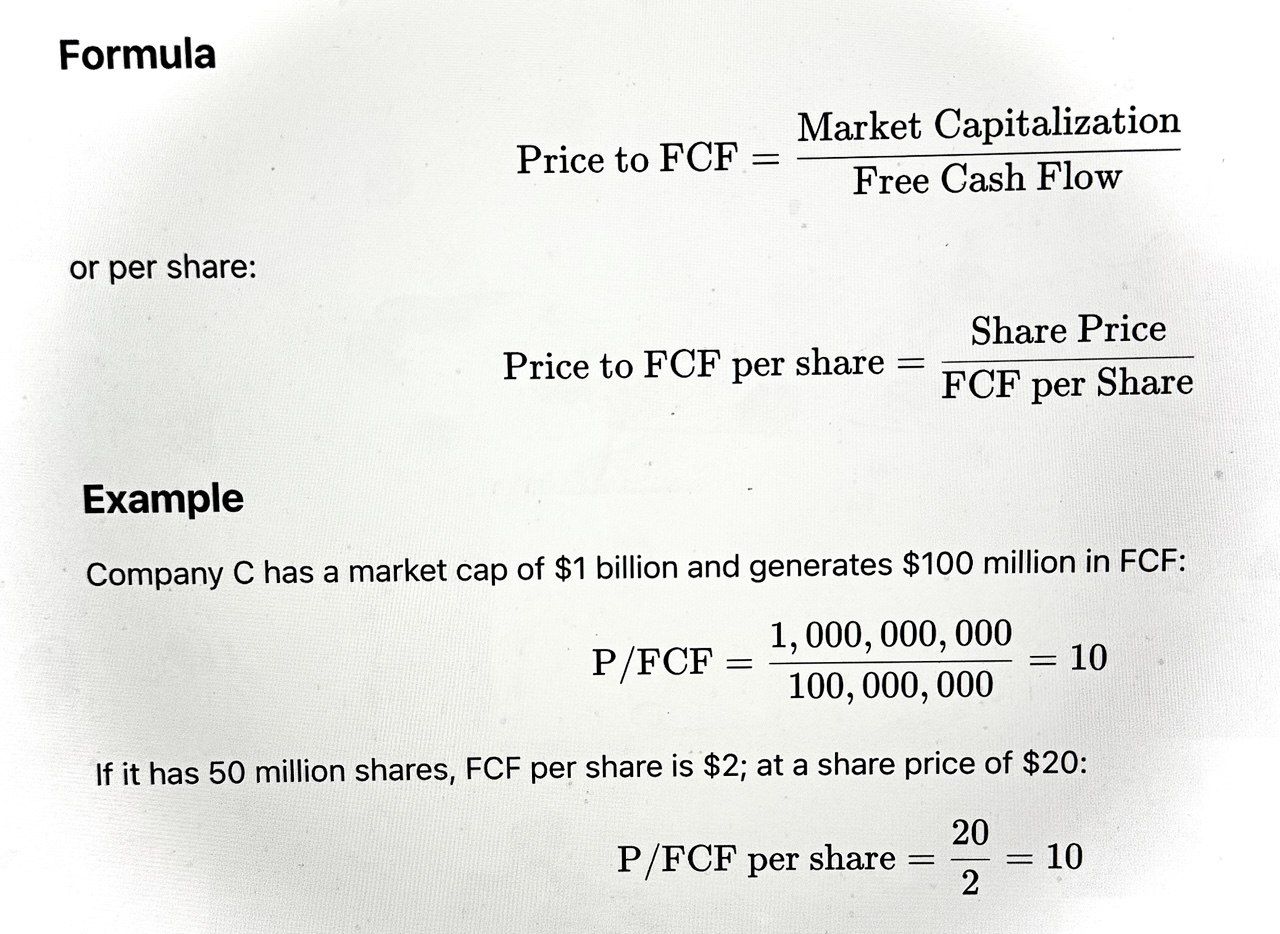
Price to Free Cash Flow compares a company’s market value (share price) to its free cash flow per share, much like the price-to-earnings (P/E) ratio but using actual cash instead of accounting earnings.
Interpretation & Usage
- A lower P/FCF can indicate undervaluation or a bargain, especially compared to peers or historical averages.
- A high P/FCF might be justified for rapid growers, but can signal overvaluation or risky expectations.
Buy/Sell Strategy:
- Buy: Companies with a low P/FCF and healthy, sustainable FCF generation.
- Sell: Companies with high P/FCF unless supported by strong FCF growth outlook.
Real-World Example:
Value investors often screen for stocks with a P/FCF below 15–20, particularly in stable, mature industries.
Operating Cash Flow Ratio
Definition
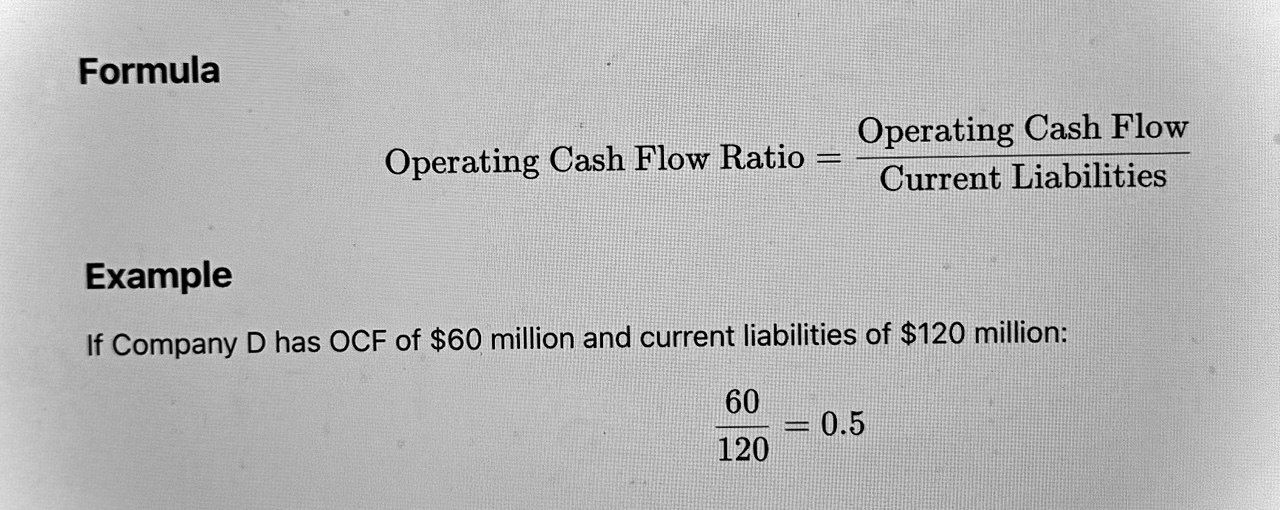
This liquidity ratio compares operating cash flow to current liabilities, showing how easily a company’s operating cash covers short-term debts.
Interpretation & Usage
- A ratio above 1 means the company generates enough cash to cover all short-term obligations.
- A ratio below 1 signals possible liquidity risk, especially if it falls persistently.
Buy/Sell Strategy:
- Buy: Companies with stable or rising OCF ratios, particularly above 1.
- Sell: Firms with persistently low or declining ratios, especially during economic stress.
Real-World Example:
During recessions, investors prefer companies with high OCF ratios, expecting them to weather downturns better.
Capital Expenditure (CapEx) Strategies
Definition
CapEx are investments in long-term assets (e.g., factories, equipment, infrastructure) necessary for a company to maintain or expand its business. The level, trend, and efficiency of CapEx are closely watched.
Interpretation & Usage
- High CapEx: May signal growth, new projects, or upgrades—but also means less cash is available for dividends or buybacks in the short term.
- Low CapEx: Can free up cash for shareholders, but may risk underinvestment and future stagnation.
Buy/Sell Strategy:
- Buy: Companies balancing CapEx and FCF—investing for growth but not overextending.
- Sell: Companies with runaway CapEx and falling FCF, or those underinvesting and risking obsolescence.
Real-World Example:
Intel (INTC) and other semiconductor firms must invest billions in CapEx for new chip plants. Analysts scrutinize CapEx plans to judge long-term competitiveness.
How Investors Use Cash Flow Metrics to Buy and Sell Stocks
- Income & Value Investors: Look for companies with strong and rising FCF, healthy OCF ratios, and reasonable P/FCF multiples.
- Growth Investors: Tolerate negative FCF if CapEx is driving rapid expansion—provided there’s a clear path to future FCF.
- Contrarian/Distressed Investors: Target stocks where accounting profits are suspect but cash flow remains strong, or avoid those with “profits” but negative OCF/FCF.
- Risk Management: Investors sell or avoid stocks with chronic negative FCF, poor OCF coverage, or excessive CapEx without returns.
Portfolio Example:
A prudent investor might buy a stock with a 10x P/FCF, rising OCF, and manageable CapEx—while avoiding companies with negative FCF and aggressive capital spending.
References
White, G. I., Sondhi, A. C., & Fried, D. (2003). The Analysis and Use of Financial Statements. Wiley.
Damodaran, A. (2012). Investment Valuation: Tools and Techniques for Determining the Value of Any Asset. Wiley.
CFA Institute. (2023). CFA Level 1 Curriculum – Financial Reporting and Analysis.
Investopedia. (2024). “Cash Flow Statement,” “Free Cash Flow,” “Operating Cash Flow Ratio,” “CapEx.”
Yahoo Finance, Company Filings.